install.packages("package_name") # install from CRAN
library(package_name) # Load it after installationData, Software, Setup and Libraries (Packages)
1 Get the Data Used
The data used in this practical session are available in the project’s dedicated GitHub repository. The analysis is based on daily observed streamflow records and climate projection data for the LEZ watershed. Detailed metadata for this watershed are available on the HydroPortail website (here).
2 R (environment) & Rstudio (IDE)
Note
An IDE (Integrated Development Environment) is a software application that provides developers with a comprehensive set of tools for writing, testing, and debugging code in one place.
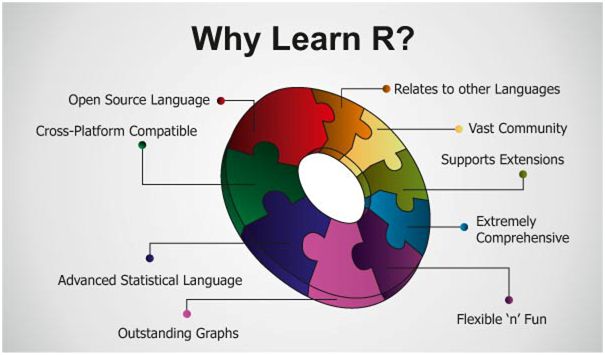
2.1 🧠 What is R?
R is a programming language and software environment designed primarily for statistical computing, data analysis, and visualization.
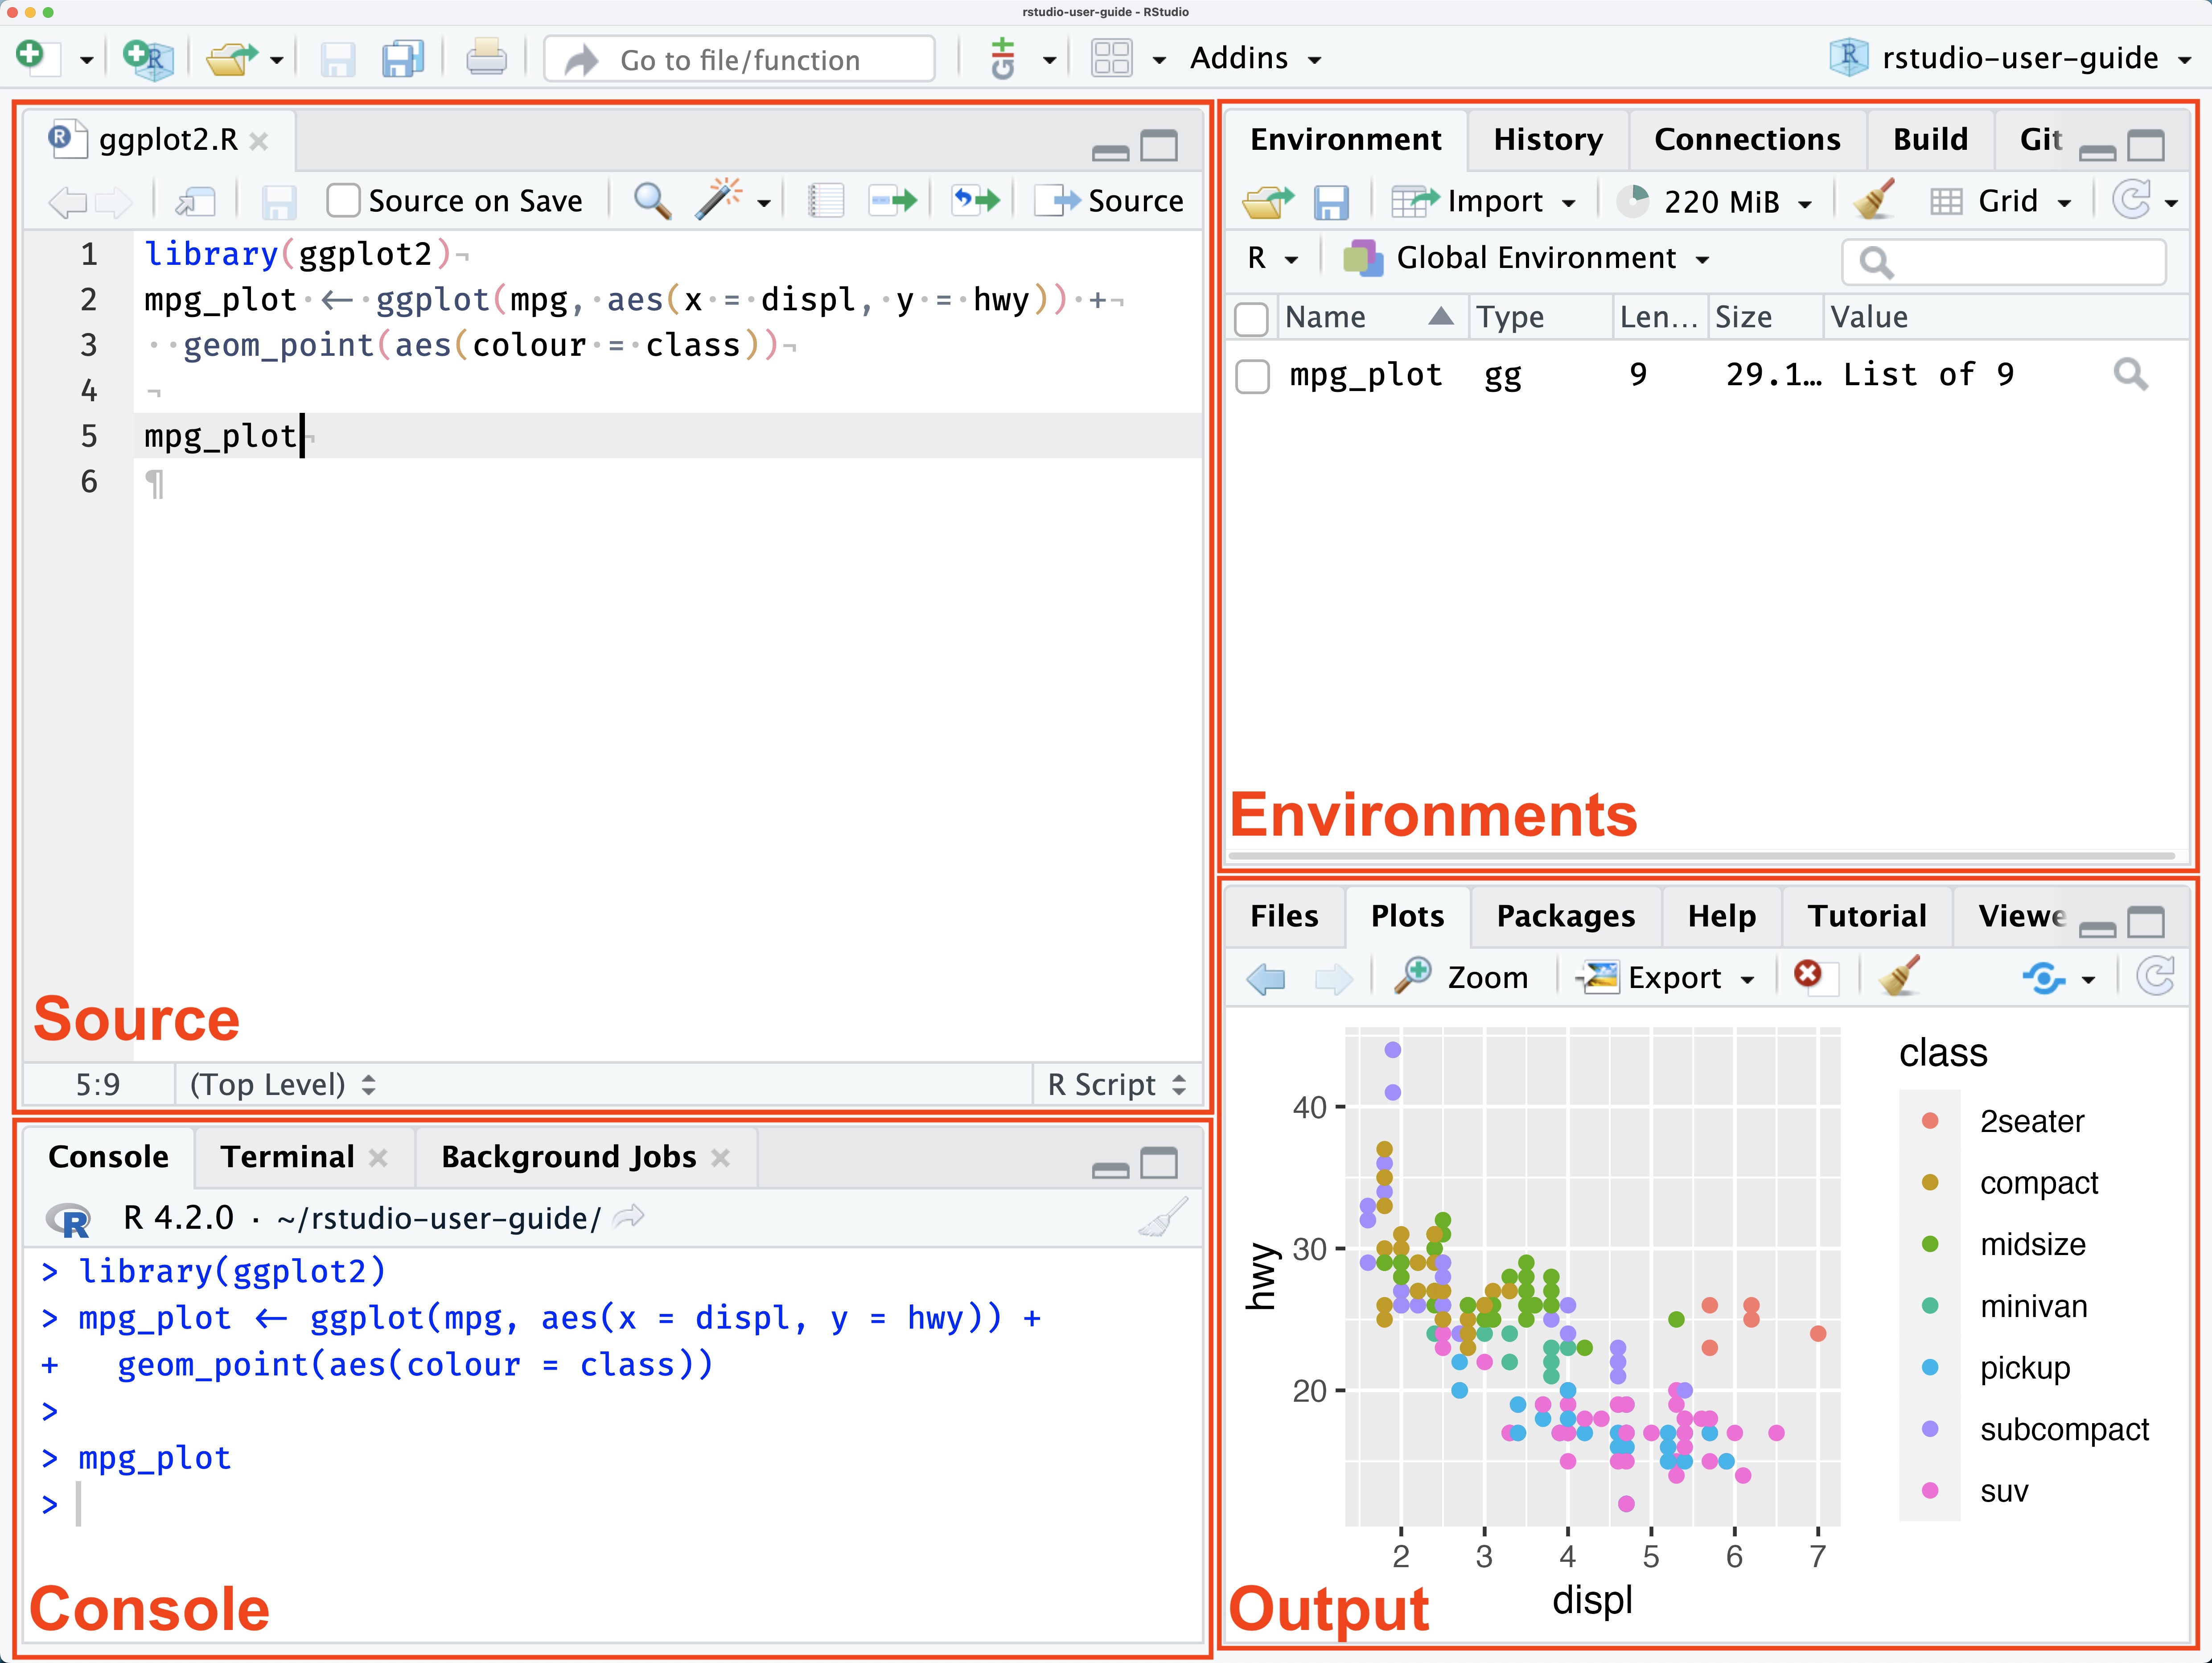
2.2 🖥️ What is RStudio?
RStudio is an IDE (Integrated Development Environment) specifically made for working with R. It provides a much more convenient and powerful interface than the basic R console:
- 📝 Script editor with syntax highlighting and auto-completion
- 💻 Console for interactive execution
- 📦 Environment viewer to see your variables, functions, and data
- 📊 Plot viewer, 🗂️ file browser, 📖 help pane, and more
- ⚙️ Easy access to package management, 🔄 version control, and 📄
R Markdown / Quarto
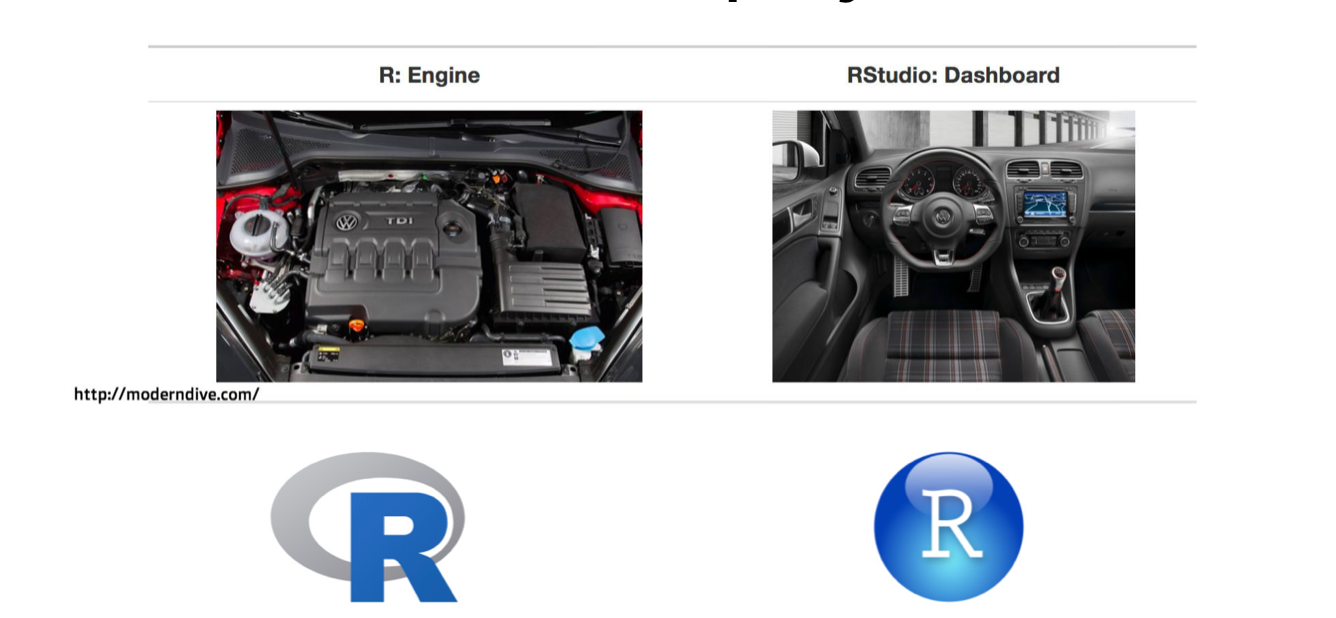
2.3 🔧 How to use them together?
1- Install R → https://cran.r-project.org
2- Install RStudio → https://posit.co/download/rstudio-desktop/
3- Then, open RStudio → it will automatically use the installed R engine in the background.
3 Libraries (Packages)
Below are the R packages used in this practical, with links and short descriptions. The simplest, general way to install any R package is:
If the package is on GitHub, we can use the remotes or devtools package:
# install remotes if not already installed
if (!requireNamespace("remotes", quietly = TRUE)) install.packages("remotes")

# install a package from GitHub
remotes::install_github("username/repo_name")

# Load it
library(package_name)
The R packages used in this practical
📦 {dplyr} — Grammar of data manipulation, providing a consistent set of verbs that solve the most common data manipulation challenge.
📦 {tidyr} — Help you create tidy data.
📦 {zoo} — Tools and functions for time series analysis and manipulation.
📦 {trend} — Provides non-parametric tests test for trend detection.
📦 `{lubridate} — To work with date-times and time-spans.
📦 {extRemes} — For fitting and analyzing extreme value distributions.
📦 {airGR} — GR hydrological models toolbox for rainfall–runoff modeling.
📦 {hydromad} — Provide a modelling framework for environmental hydrology.
📦 {EnvStats} — Graphical and statistical analyses of environmental data.
📦 {MBC} — For calibrating and applying univariate and multivariate bias correction algorithms for climate model simulations of multiple climate variables.